INDEX PERFORMANCE
The chart and tables below show the back-tested levels of the S&P 500 Futures Defined Volatility 35% Decrement 6% Index. The Index was launched on 26th April 2024. All data prior to such date is back-tested hypothetical data.Past performance is no guarantee of future results. Chart and tables are provided for illustrative purposes and reflect hypothetical historical performance.
For more information, please consult our INDX related page.
Index overview & statistics – Hypothetical & Historical exposure as of .
| Bloomberg Ticker | SPXFD356 Index |
| Calculation Agent | S&P Dow Jones Indices |
| Index Sponsor | S&P Dow Jones Indices |
| Index Start Date | 28th October 2005 |
| Index Launch Date | 26th April 2024 |
| Index Type | Excess return1 |
| Weighting | Daily rebalancing |
| Index Performance Based on Back-tested Data |
S&P 500 Futures 35% Defined Volatility 6% Decrement Index |
S&P 500 Index |
| 5Y ANNUALIZED RETURN | ||
| 10Y ANNUALIZED RETURN | ||
| ANNUALIZED VOLATILITY (SINCE 28 OCT 2005) |
Source: Bloomberg, BNP Paribas from 28th October 2005 to .. All numbers and figures are annualized. Comparative index is the S&P 500 (SPX Index).
Index Performance – Hypothetical & Historical as of .
Source: Bloomberg, BNP Paribas from 28th October 2005 to ..
Hypothetical Past Performance of the S&P 500 Futures 35% Defined Volatility 6% Decrement Index.
S&P 500 Futures 35% Defined Volatility 6% Decrement Index
S&P 500 Index
Yearly Index Returns – As of 31st December 2024
| 2006 | 2007 | 2008 | 2009 | 2010 | 2011 | 2012 | 2013 | 2014 | 2015 | 2016 | 2017 | 2018 | 2019 | 2020 | 2021 | 2022 | 2023 | 2024 | |
| SPXFD356 Index | 16.79% | -16.71% | -54.27% | 26.57% | 13.33% | -12.30% | 20.02% | 87.72% | -1.12% | -29.35% | 9.38% | 91.64% | -24.36% | 66.83% | 3.50% | 55.29% | -42.06% | 33.52% | 25.06% |
| S&P 500 Index | 13.62% | 3.53% | -38.49% | 23.45% | 12.78% | -0.00% | 13.40% | 29.60% | 11.39% | -0.73% | 9.54% | 19.42% | -6.24% | 28.88% | 16.26% | 26.89% | -19.44% | 24.23% | 23.10% |
Source: Bloomberg, BNP Paribas from 1st January 2006 to 31st December 2024.
1The S&P 500 Futures 35% Defined Volatility 6% Decrement Index is an “Excess Return Index” meaning its returns are derived from changes in the level of its components (known as “price return”) and profit or loss gained from rolling from one futures contract to another (known as “roll return”). Unlike Total Return Indices, it does not derive returns based on interest earned on cash or other collateral deposited in connection with the purchase of futures contracts (known as “collateral return”).
Hypothetical & Historical Leverage – As of 30th April 2026
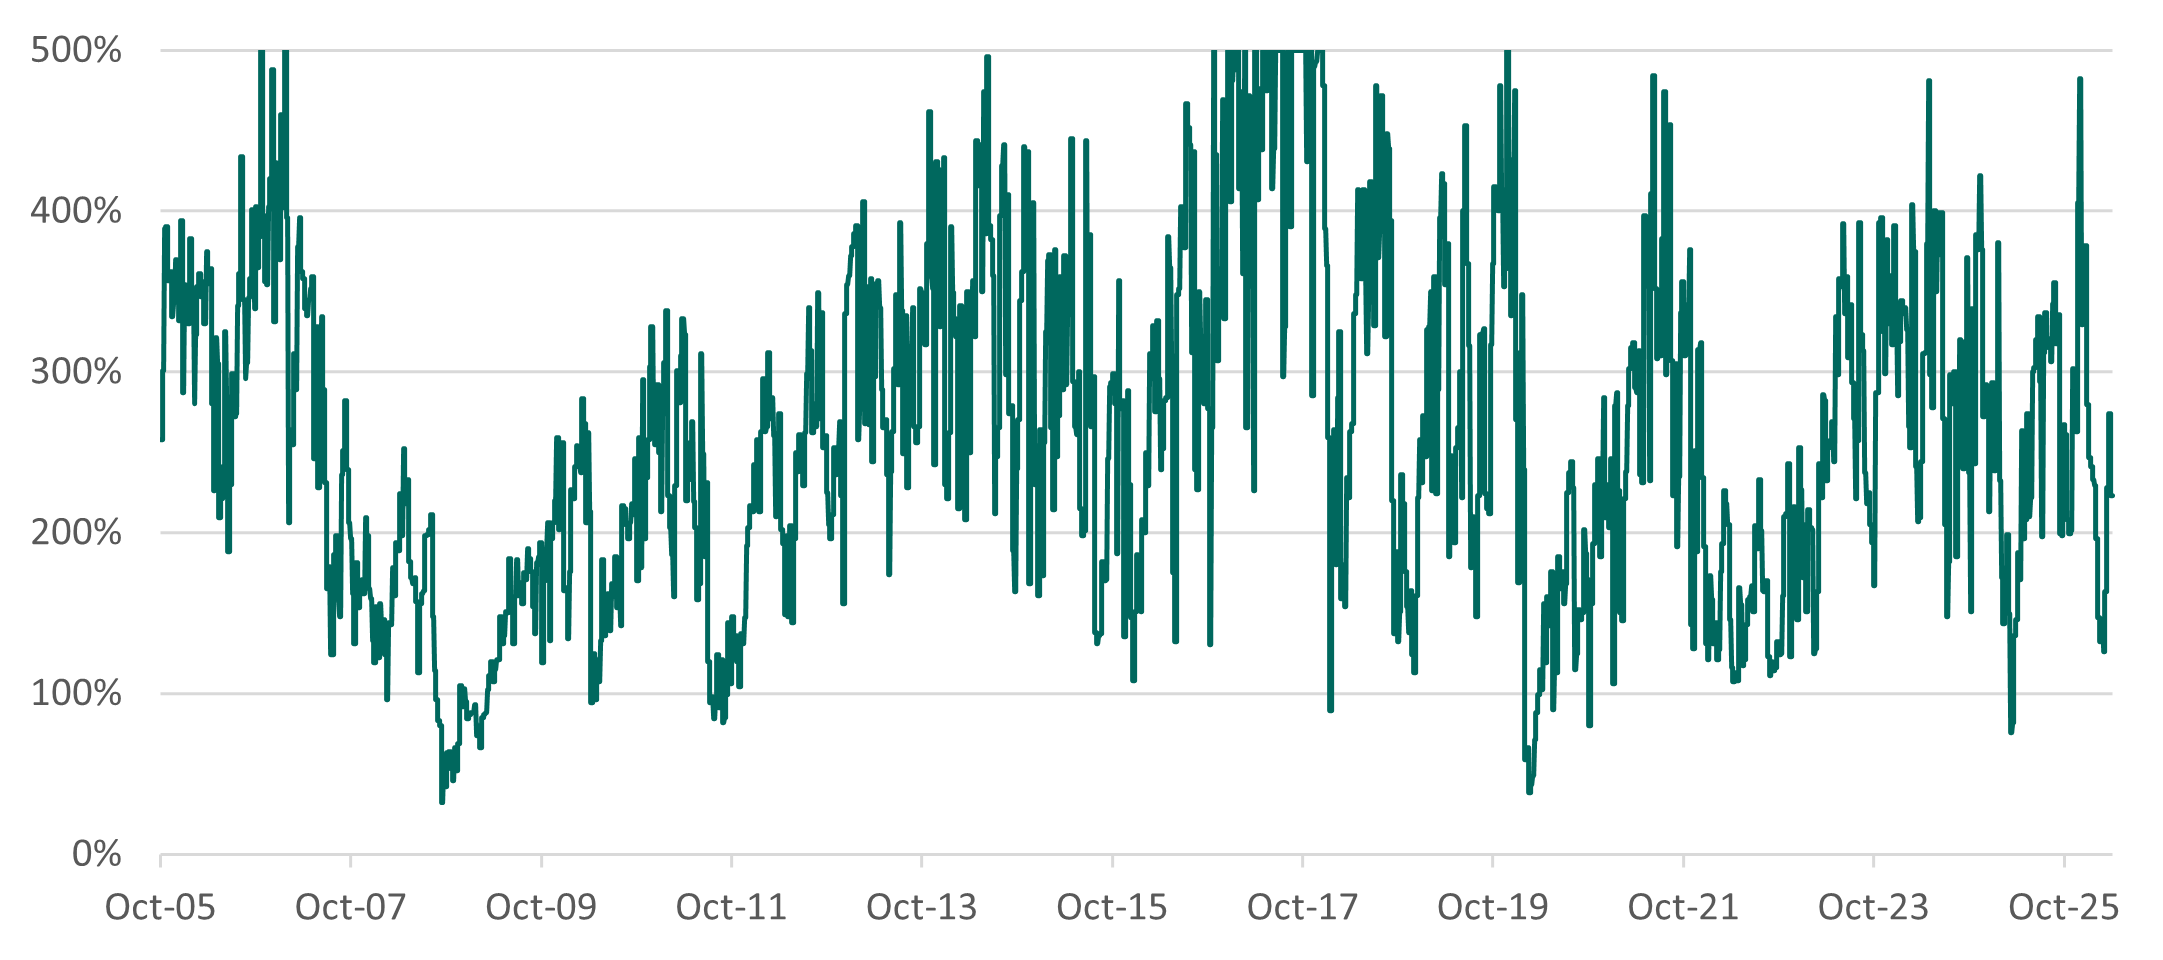
Source: Bloomberg, BNP Paribas from 28th October 2005 to 30th January 2026. The leverage information is accessible through the Bloomberg ticker SPXF356L.
Past performance is not an indicator of future performance. The S&P 500 Futures 35% Defined Volatility 6% Decrement Index is based on Hypothetical Past Performance Data (”PPD”) prior to the Index Launch Date on 26 April 2024, actual/historical performance begins after Launch Date. Because the S&P 500 Futures 35% Defined Volatility 6% Decrement Index did not exist prior to the Launch Date, all retrospective levels provided in the graph and table above are simulated and must be considered illustrative only. The presentation of hypothetical data reflects the deduction of fees and charges. These simulations are the result of estimates made by BNP Paribas at a given moment on the basis of the parameters selected by BNP Paribas, certain assumptions that may or may not hold in future periods, of market conditions at this given moment and of historical data, which should not be used as guidance, in any way, of the future results of the S&P 500 Futures 35% Defined Volatility 6% Decrement Index.
RISK WARNINGS FOR HYPOTHETICAL PERFORMANCE DATA
This discussion is not and should not be construed to be investment advice or an offer to sell or purchase or solicitation of an offer to sell or purchase any security or other instrument.
This document describes strategies that may or may not be suitable or appropriate for particular investors and any investor is urged to consult with its investment, tax, accounting and other advisers prior to investing. Neither BNP Paribas nor any of its affiliates make any recommendation as to the suitability of any strategy or index for investment.
Selected Risk Consideration related to the Index:
- The Index is leveraged (up to 500%) which might generate higher drawdowns.
- The Index has a volatility of 35% by construction, higher than regular broad-based benchmarks.
- The Index might underperform the S&P 500 due to the 6% synthetic dividend.
- The methodology underlying the Index may not be successful — No assurance can be given that the strategy or objectives of the Index will be achieved.
- Numerous factors (including, but not limited to, changes in: interest rates, investor expectations, economic results, regulations, liquidity) may affect the components of the Index and the performance of the Index.
- The Index involves synthetic execution and may not reflect actual market activity.
- The Index may contain embedded fees, which will reduce performance. Fees are determined based on certain assumptions and may not reflect actual market activity. The amount of fees deducted may vary under different market conditions.
- The methodology and rules related to the Index is subject to change.
- The Index has limited historical information and publicly available information on the Index is limited. Additional information available upon request.
- Volatility control mechanism may limit performance.
- Rebalancing may result in concentration risk and/or be partially or completely uninvested and may not achieve performance.
- The use of leverage will have increased exposure to the index components.
Selected Risk Considerations related to the Hypothetical Performance:
Future performance may be worse than past and hypothetical historical results. Certain levels are simulated and must be considered hypothetical and illustrative only. Actual performance may bear little relation to the hypothetical historical results.
Hypothetical past performance is based on criteria applied retroactively with the benefit of hindsight and knowledge of factors that may have positively affected its performance, and cannot account for all financial risk that may affect the actual performance of the Index.
Hypothetical past performance might not reflect all possible market conditions. The Index may perform differently under other market conditions.
Little information is available publicly about the Index. Additional information regarding the methodology and rules related to the Index are available upon request.