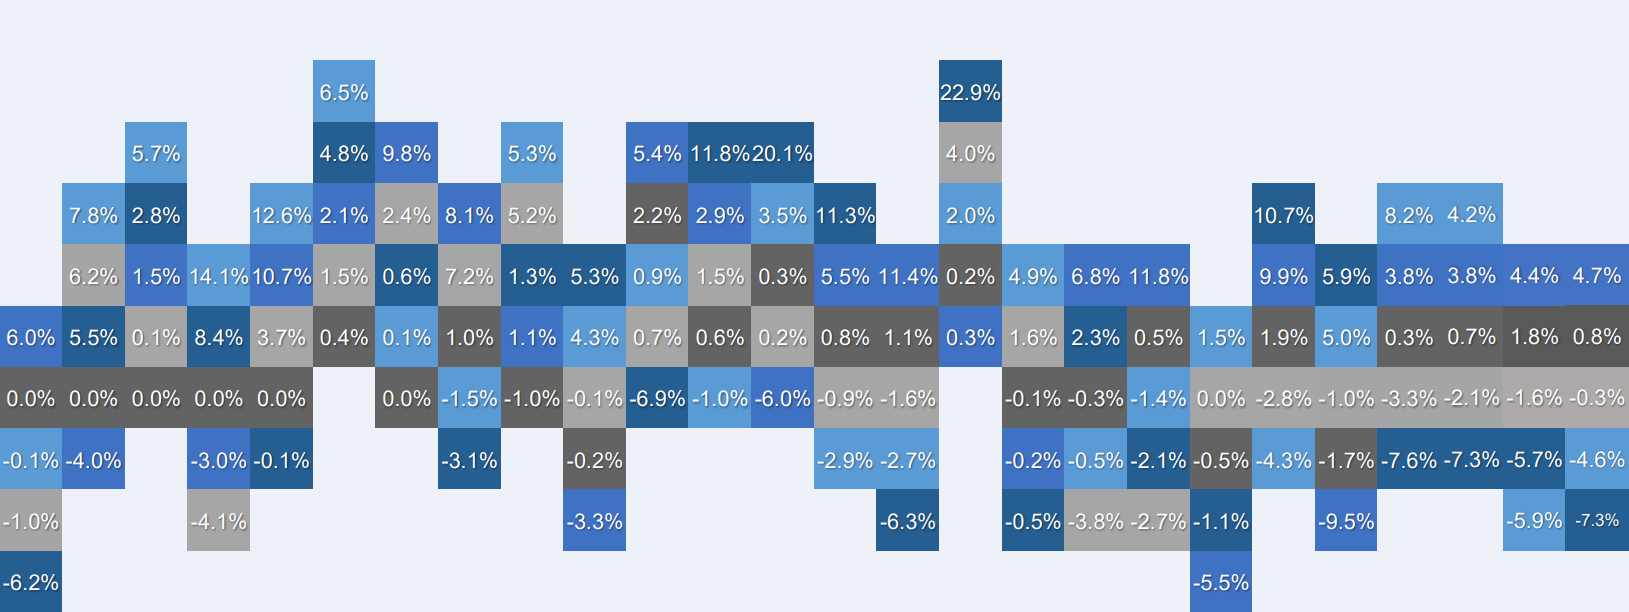
The charts and tables below show the levels of the BNP Paribas Cross Asset Trend Index.
The performance shown is hypothetically simulated until July 12th, 2018.
Index Overview & Statistics as of .
| Bloomberg ticker | BNPICTX |
| Calculation Agent | BNP Paribas Arbitrage SNC |
| Index Sponsor | BNP Paribas |
| Index Type | Excess return(1) |
| Weighting | Daily rebalancing |
| Index Launch Date | July 12th 2018 |
| Global | YTD | Last 1 Year | Last 3 Years | Last 5 Years | Last 10 Years | |
| Return | ||||||
| Volatility | ||||||
| Sharpe Ratio |
Source: Bloomberg, BNP Paribas from 30 December 1994 to .. All numbers and figures are annualized.
Index Performance as of .
Hypothetical Past Performance
(1) The BNPP Cross Asset Trend Index is an “Excess Return Index” meaning that the Index level reflects the performance of any underlying components that are in excess of 3-month USD LIBOR and inclusive of the value that would be derived from the reinvestment of any dividends and distributions by the issuer of any such components. See the Risks & Consideration page for additional Index disclosures.
COMPOSITION
The charts and tables below show the levels of the BNP Paribas Cross Asset Trend Index.
The performance shown is hypothetically simulated until July 12th, 2018.
Hypothetical & historical exposure as of November 29th 2024.
| Equities | Rates | Commodities | Forex | Credit |

| Asset Class Exposure (%) | Rates | Credit | Equities | Forex | Commodities | Net Exposure |
| As of November 29th 2024 | 89.24% | 49.41% | 72.60% | -43.51% | -1.68% | 166.06% |
Hypothetical & historical performance contribution per asset class as of November 29th 2024.

| Equities | Rates | Commodities | Forex | Credit |
Past performance is not an indicator of future performance. The BNP Paribas Cross Asset Trend Index is based on Hypothetical Past Performance Data (“HPPD”) prior to July 12th 2018. Because the BNP Paribas Cross Asset Trend Index did not exist prior to this date, all retrospective levels and compositions provided in the graph and table above are simulated and must be considered illustrative only. The presentation of hypothetical data reflects the deduction of fees and charges. These simulations are the result of estimates made by BNP Paribas at a given moment on the basis of the parameters selected by BNP Paribas, certain assumptions that may or may not hold in future periods, of market conditions at this given moment and of historical data, which should not be used as guidance, in any way, of the future results of the BNP Paribas Cross Asset Trend Index.
Risk warnings for hypothetical performance data
- Future performance of the Index may be worse than hypothetical historical results. All levels are simulated and must be considered hypothetical and illustrative only. The actual performance of the Index may bear little relation to the hypothetical historical results.
- BNP Paribas makes no recommendation as to the suitability of the Index for investment. You should reach a decision after careful consideration with your advisors.
- Future performance of the Index may be worse than past and hypothetical historical results.
- The methodology underlying the Index may not be successful — No assurance can be given that the Index methodology will achieve its goals.
- Numerous factors (changes in: interest rates, investor expectations, economic results, regulation, liquidity, etc.) may affect the price of the components of the Index.
- Hypothetical past performance is based on criteria applied retroactively with the benefit of hindsight and knowledge of factors that may have positively affected its performance, and cannot account for all financial risk that may affect the actual performance.
- The Index has limited historical information and publicly available information on the Index is limited.
- The presentation of hypothetical historical performance reflects the deduction of fees and charges applicable to the Index.

